I previously wrote about how the underlying technology for Fabric mirroring changed with SQL Server 2025. The latest version of mirroring that uses the SQL Server Change Feed is reading from the database transaction logs and pushing the data to a landing zone in OneLake. The data is then merged into the Delta tables for the Fabric mirrored database.
In this blog post, we will look at how to monitor this process, both in SQL Server and in Fabric.
Monitoring in the Fabric Portal
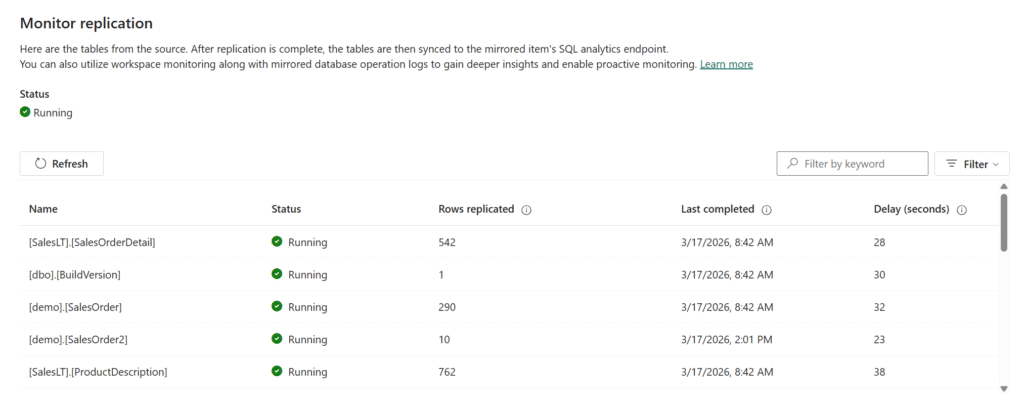
The item page for the mirrored database in the Fabric portal shows replication status for the database overall as well as for each table. The per-table status includes:
rows replicated: the cumulative count of replicated rows, including all inserts, updates, and deletes applied to the target table
last completed: the last time the mirrored table was refreshed from the source
delay (seconds): the time between when a change was committed at the source and when it was successfully applied to the destination
It is possible for the overall database status to show “Running” while a specific table has an issue. The last completed date will typically reflect the last time data in the table changed — if nothing has changed, nothing is sent and the date does not update. The delay is tracked on the database side and sent to Fabric for display on the monitoring page.
Monitoring in the Database
When you configure Fabric mirroring, it enables the change feed on the database and the tables you have selected to mirror. Once everything is configured, there are some system views and stored procedures you can access to see what’s going on.
sys.dm_change_feed_log_scan_sessions
This DMV is your primary window into change feed health and activity. It returns one row per log scan session, plus an aggregate row where session_id = 0 that summarizes all sessions since the instance last started. The aggregate row is useful for understanding overall health since the instance last started; the individual session rows show you what’s happening in discrete scans.
You want to see sessions completing without errors, with tran_count incrementing and currently_processed_lsn or currently_processed_commit_lsn advancing over time. If sessions are stalling at the same batch_processing_phase repeatedly, or error_count is climbing, something needs attention.
The schema_change_count column tracks DDL-related log records processed in a session. Note that this is not a 1:1 mapping with the number of DDL operations — some operations, like adding, altering, or dropping a column, generate two log records per operation, so the count may be higher than you expect.
sys.dm_change_feed_errors
When error_count in the sessions DMV is non-zero, this is where you find out what went wrong. Some errors are transient and will resolve on their own; others won’t. Repeated errors of the same type are a signal to investigate rather than wait it out.
sys.sp_help_change_feed
This stored procedure gives you a configuration-level view of which tables are enrolled in mirroring and their current state. It’s useful after initial setup to confirm everything was picked up correctly, and when a table stops replicating and you want to verify it’s still enrolled.
sys.databases
Unlike CDC, the change feed doesn’t write to change tables in the source database, so it won’t directly cause the transaction log to grow. However, it does hold log truncation until changes are successfully replicated to Fabric. You can use is_data_lake_replication_enabled = 1 to filter sys.databases to only the databases where Fabric mirroring is enabled. A value of REPLICATION for log_reuse_wait_desc means mirroring is currently holding log truncation — not necessarily something that needs immediate action, but if log usage is also growing, that’s a signal that mirroring may not be keeping pace and warrants investigation. If the log hits its size limit, writes to the database will fail.
Extended Events
Microsoft also provides an extended events session you can use for deeper troubleshooting. The session captures change feed activity including errors, snapshots, performance, and scheduler events. Because it can be verbose, Microsoft recommends only running it when you’re actively troubleshooting a problem rather than leaving it on all the time. You can find the session definition in the Troubleshoot Fabric Mirrored Databases from SQL Server documentation.
Files in OneLake
You can use Azure Storage Explorer to browse the files for your Fabric mirrored database.
The Monitoring folder contains two files:
tables.json shows each mirrored table along with its status, any error message, and metrics.
replicator.json shows the overall database replication status along with any error message.
The Manifest_1.json file in the LandingZone folder is a newline-delimited JSON log that records everything the change feed has published to OneLake — initial snapshots, incremental change batches, DDL events, and table creation notifications. It’s not something you’d monitor routinely, but it’s useful for troubleshooting — for example, to confirm that a snapshot completed and how many rows were captured, to see whether incremental batches are being written, or to trace when a DDL change occurred and verify that a re-snapshot was triggered as a result.
Within each table’s subfolder you’ll find a TableSchema.json file with the table’s schema definition, a FullCopyData folder where the initial snapshot parquet files are written, and a ChangeData folder where incremental CSV change files land after the snapshot completes. If you’re troubleshooting a data discrepancy or want to confirm that specific changes have made it to OneLake, you can browse these folders directly to check whether the expected files are present.
Knowing Where to Look
For day-to-day health checks, the portal monitoring page and sys.dm_change_feed_log_scan_sessions will cover most of what you need. If you see errors or stalled sessions, sys.dm_change_feed_errors and sys.sp_help_change_feed are the next stop. The OneLake files and extended events are there when you need to dig deeper into a specific problem. Mirroring continues to get new features and changes, so keep an eye on the Microsoft Fabric Mirrored Databases from SQL Server documentation for updates.
The post Monitoring Fabric Mirroring for SQL 2025 first appeared on Data Savvy.
To provide the best experiences, we use technologies like cookies to store and/or access device information. Consenting to these technologies will allow us to process data such as browsing behavior or unique IDs on this site. Not consenting or withdrawing consent, may adversely affect certain features and functions.
Functional
Always active
The technical storage or access is strictly necessary for the legitimate purpose of enabling the use of a specific service explicitly requested by the subscriber or user, or for the sole purpose of carrying out the transmission of a communication over an electronic communications network.
Preferences
The technical storage or access is necessary for the legitimate purpose of storing preferences that are not requested by the subscriber or user.
Statistics
The technical storage or access that is used exclusively for statistical purposes.The technical storage or access that is used exclusively for anonymous statistical purposes. Without a subpoena, voluntary compliance on the part of your Internet Service Provider, or additional records from a third party, information stored or retrieved for this purpose alone cannot usually be used to identify you.
Marketing
The technical storage or access is required to create user profiles to send advertising, or to track the user on a website or across several websites for similar marketing purposes.