• Link to Facebook
  • Link to Instagram
  • Link to LinkedIn
  • Link to Youtube
  • Link to X
Call Us Today! 512-640-5750
Data Architect as a Service | Remote DBA Services
  • Services
    • Analytics Architecture
    • Database Architecture
    • Software Architecture
    • Microsoft Fabric Consulting
      • Microsoft Fabric Health Check
  • About Us
    • Testimonials
    • Recommendation Program
    • Jobs
      • Data Engineering Consultant
      • Principal Data Analytics Architect
  • Resources
    • Blog
    • Videos
  • Contact
  • Click to open the search input field Click to open the search input field Search
  • Menu Menu

Tag Archive for: SQL Server 2017

Why is my SQL Server query slower than normal?

Performance Tuning

Have you ever had a query that runs frequently start to randomly go slower? We all have and without the proper tools and knowledge, this can be hard to figure out because there can be so many different reasons. In this blog post, our goal is to make your query optimization in SQL Server a lot better and easier for you.

How does a SQL Server query get proccessed?

This is a great question. All queries get put into a queue if they are not available to run. If there are any available schedulers then the query will start processed. We call this the RUNNING state. If the RUNNING query needs to pause to obtain any required resource like pages from disk or is blocked this query will have SUSPENDED state. Once the required pause is no longer needed, the query status will go back into the queue and its status will now be “RUNNABLE”. This queue is first in first out (FIFO) and once the query moves up the queue and a schedule is free the query is back in motion and has the “RUNNING” status again. This circle can be repeated multiple times until the query execution completes.

Hopefully, our flow process of the status of a query will make sense below.

The cycle of states for a running query.

How do we see the waits for my query?

Now that you understand how a query waits. Lets go ahead and look at how we recommend reviewing this data. Before SQL Server 2017 you had to a bit of work with extended events and dynamic management views. Now we can use our best friend, the query store.

In this video below you will learn how to figure out what waits occurred when your query was executed inside of SSMS without writing a single line of code.

Lets look and see why your query is running slow…

What are your thoughts about getting quick access to waits going on for your queries? Got aditional questions? Let us know in the comments section down blow.

Can I get the demo code?

We know some of you love to replay demos and we like to give you the code to do so when you have free time. If you have any questions with the demo below fill free to throw your questions our way.

USE [master];
GO
ALTER DATABASE [WideWorldImporters] 
SET QUERY_STORE (OPERATION_MODE = READ_WRITE, 
     DATA_FLUSH_INTERVAL_SECONDS = 60, 
     QUERY_CAPTURE_MODE = ALL, /* For demo purposes.
     most likely don't want to capture all in prod */
     INTERVAL_LENGTH_MINUTES = 1);
GO

USE [WideWorldImporters];
GO
DBCC DROPCLEANBUFFERS; -- For demo to get PAGEIOLATCH waits
ALTER DATABASE CURRENT SET QUERY_STORE CLEAR ALL;


/* Verify Clean Starting Point */
select * from sys.query_store_plan
select * from sys.query_store_query
select * from sys.query_store_runtime_stats
select * from sys.query_store_wait_stats /* New in SQL 2017 */
GO


USE [WideWorldImporters];
GO

/* Load all records from disk into memoery 
 because we dropped clean buffers */
SELECT * FROM Sales.Invoices

/* 102 records */
SELECT * FROM Sales.Invoices
WHERE CustomerID = 832


/* Create locking example.
Begin explicit transaction 
but don't commit or rollback yet */
BEGIN TRANSACTION

UPDATE Sales.Invoices
SET DeliveryInstructions = 'Data Error'
WHERE CustomerID = 832

-- Hold off on rolling back until after the block


/* Now back in another window, 
wait a few seconds and then 
execute the following statement */
USE [WideWorldImporters];
GO
SELECT COUNT(DeliveryInstructions)
FROM Sales.Invoices
WHERE CustomerID = 832


-- After a few seconds - roll back the other transaction
/* Now Rollback and show other window has data */
ROLLBACK TRANSACTION
/* Flushes the in-memory portion of the Query Store data to disk. 
https://docs.microsoft.com/en-us/sql/relational-databases/system-stored-procedures/sp-query-store-flush-db-transact-sql?view=sql-server-2017
*/
USE [WideWorldImporters];
GO
 
EXECUTE sp_query_store_flush_db;
GO

/* 
Look at all queries in QS using Sales.Invoices.
Notice our UPDATE is missing??
We Rolled it BACK
*/
SELECT [q].[query_id], *
FROM sys.query_store_query_text AS [t]
INNER JOIN sys.query_store_query AS [q]
 ON [t].query_text_id = [q].query_text_id
WHERE query_sql_text LIKE '%Sales.Invoices%';

/* get the query_id from statement above
use it to get the plan_id so we can look at its waits */
declare @queryID bigint = 7 
SELECT *
FROM sys.query_store_plan
WHERE query_id = @queryID;

/*Get all waits for that plan. */
begin
declare @planid int = 7
select * from sys.query_store_runtime_stats_interval

SELECT * --wait_category_desc, avg_query_wait_time_ms
FROM sys.query_store_wait_stats
WHERE plan_id = @planid AND
  wait_category_desc NOT IN ('Unknown')
ORDER BY avg_query_wait_time_ms DESC;
end
GO

/* Make sure you filter for time intervals needed */
declare @planid int = 7
SELECT wait_category_desc, avg_query_wait_time_ms
FROM sys.query_store_wait_stats
WHERE plan_id = @planid AND
  wait_category_desc NOT IN ('Unknown')
ORDER BY avg_query_wait_time_ms DESC;
GO

/* Look at all waits in system */
select * from sys.query_store_wait_stats


April 10, 2019/by John Sterrett
https://procuresql.com/wp-content/uploads/2018/09/Procure-SQL-RTO-RPO-1.jpg 561 1076 John Sterrett /wp-content/uploads/2024/05/Data-Architecture-as-a-Service-with-ProcureSQL.png John Sterrett2019-04-10 04:41:092019-04-10 04:41:09Why is my SQL Server query slower than normal?

Where did my string or binary data get truncated?

Data Architecture, Design

[Updated on 10/25/2018]

With MSIgnite being this week tons of great new features are being announced.  While many will focus on Spark integration, performance tuning, security, and containers sometimes it’s the simple things that give us the most value. I will talk about a feature that is hidden on page 17 in Microsoft’s SQL 2019 whitepaper. This feature is not getting a lot of love now but everyone will love it.  I will be honest, I didn’t even know about it until reading the white paper.  What is really super cool is that this new feature will find its way into SQL Server 2017 and SQL Server 2016. More on this in a bit.

In the past, I have struggled with the classic string truncation error. Everyone has at one point in time or another. It’s tricky to troubleshoot especially when you are processing a big batch of data.

String or binary data would be truncated

So even in SQL 2019, SQL Server 2017 CU12, and SQL Server 2016 (upcoming SQL Server 2016 SP2 CU)  by default, you will see the very classic “string or binary data would be truncated. The statement has been terminated.” message. Developers, DBA’s, IT Professionals, and almost everyone who has ever touched SQL Server have seen this frustrating error at least once. It is very frustrating for two separate reasons. One, you have no idea which column had the truncation. Second, you have no idea which row also had the error.

Let’s take a look at a very simple example.

use [tempdb]
go

if exists (select 1 from sys.tables where name like 'WorldSeries')
drop table dbo.WorldSeries
GO

CREATE TABLE dbo.WorldSeries (TeamName varchar(200), Championships varchar(3))
GO

INSERT INTO dbo.WorldSeries (TeamName, Championships) VALUES ('Texas Rangers', null)

INSERT INTO dbo.WorldSeries (TeamName, Championships) VALUES ('Houston Astros', 'one'), 
('Atlanta Braves', 'two'), ('Pittsburgh Pirates', 'five')
GO

You will see that our first statement on inserting the Texas Rangers completes successfully even though the Rangers have zero (I like NULL) championships.  We have an error in the next batch of doing three inserts in a single query so the whole transaction will rollback. In this example, we could figure out where our error is but let’s pretend we are doing a massive data load into several columns with billions of records. Actually, I don’t even want to think about troubleshooting that and with this new hot feature in SQL Server 2019, you won’t have too either.

SQL Server 2019 Feature Everyone Will Love

Okay, I think you know where this is going… Let’s not prolong this any longer. We will rerun the last statement with just adding trace flag 460.

DBCC traceon(460)
INSERT INTO dbo.WorldSeries (TeamName, Championships) VALUES ('Houston Astros', 'one'), 
('Atlanta Braves', 'two'), ('Pittsburgh Pirates', 'five')

GO

Now it is crystal clear.  The Pittsburgh Pirates have won too many championships to fit into this table. Okay, I guess we can both agree the string “five” is too big to fit into a varchar(3) column.

John’s Thoughts and Recommendation

All you have to do in SQL Server 2019 CTP 2.0 (Current newest public release) is enable trace flag 460.  I hope, the need for trace flag 460 goes away when SQL Server 2019 is Generally Available.  That said, enabling the trace flag is easy and this feature is going to be a lifesaver especially for people consuming data from other sources and struggle troubleshooting data that doesn’t fit into their data model due to the length of a value.

I am sure I am not the only person who provided feedback on this new feature to Microsoft.  That said, I am really excited to see Pedro’s announcement that the trace flag 460 shouldn’t be required when SQL Server 2019 is Generally Available (GA). The new error message (message 2628) will replace the old error message (message 8152). I am also excited that you will be able to utilize this new feature in SQL Server 2016 and 2017. It makes perfect sense for backward compatibility that you will need to provide trace flag 460 if you are using SQL Server 2017 CU 12 or SQL Server 2016.  Way to go Pedro and the SQL Server Team. This is amazing news!

use [tempdb]
go

if exists (select 1 from sys.tables where name like 'WorldSeries')
drop table dbo.WorldSeries
GO

CREATE TABLE dbo.WorldSeries (TeamName varchar(200), Championships varchar(3))
GO

INSERT INTO dbo.WorldSeries (TeamName, Championships) VALUES ('Texas Rangers', null)

INSERT INTO dbo.WorldSeries (TeamName, Championships) VALUES ('Houston Astros', 'one'), 
('Atlanta Braves', 'two'), ('Pittsburgh Pirates', 'five')
GO
September 26, 2018/by John Sterrett
https://procuresql.com/wp-content/uploads/2018/09/Procure-SQL-string-or-binary-data-get-truncated-2.jpg 960 1440 John Sterrett /wp-content/uploads/2024/05/Data-Architecture-as-a-Service-with-ProcureSQL.png John Sterrett2018-09-26 16:46:092018-09-26 16:46:09Where did my string or binary data get truncated?

SQL Saturday Denver 2018 Resources

Performance Tuning

I had a blast speaking at SQL Saturday Denver.  To help everyone moving to SQL Server 2017  I have included my slides and demo code below.  If you end up having any questions with the code or need help feel free to contact me.

SQL Saturday Denver Bonus Content

You can also review our SQL Anti-Patterns

The following an Automatic Tuning in the Real-World example with one of our customers during their SQL Server 2017 upgrade.

September 15, 2018/by John Sterrett
https://procuresql.com/wp-content/uploads/2018/09/Procure-SQL-SQL-Saturday-Denver-2018-1.jpg 282 546 John Sterrett /wp-content/uploads/2024/05/Data-Architecture-as-a-Service-with-ProcureSQL.png John Sterrett2018-09-15 16:51:462018-09-15 16:51:46SQL Saturday Denver 2018 Resources

Automatic Tuning in the Real-World

Performance Tuning

In SQL Server 2016 we saw Query Store.  Query Store was a game changer to help database administrators identify troublesome queries. Query Store helps DBAs make those queries run faster.  Microsoft’s marketing team even jumped on to help coin the phrase, “SQL Server It Just Runs Faster.” With SQL Server 2017, this started to get even better with automatic tuning. Don’t worry database administrators.  Automatic Tuning will just enhance your career and not replace it.

SQL Server 2017 Automatic Tuning looks for queries where execution plans change and performance regresses. This feature depends on Query Store being enabled. Note, even if you don’t turn on Automatic Tuning you still get the benefits of having access to the data. That is right. Automatic Tuning would tell you what it would do if it was enabled.  Think of this as free performance tuning training.  Go look at the DMVs and try to understand why the optimizer would want to lock in an execution plan. We will actually go through a real-world example:

Automatic Tuning with SQL Server 2017

First, let’s take a quick look at the output of the data. You can find the query and results we will focus on below.

SELECT reason, score,
script = JSON_VALUE(details, '$.implementationDetails.script'),
planForceDetails.*,
estimated_gain = (regressedPlanExecutionCount+recommendedPlanExecutionCount)
*(regressedPlanCpuTimeAverage-recommendedPlanCpuTimeAverage)/1000000,
error_prone = IIF(regressedPlanErrorCount>recommendedPlanErrorCount, 'YES','NO')
FROM sys.dm_db_tuning_recommendations
CROSS APPLY OPENJSON (Details, '$.planForceDetails')
WITH ( [query_id] int '$.queryId',
[current plan_id] int '$.regressedPlanId',
[recommended plan_id] int '$.recommendedPlanId',

regressedPlanErrorCount int,
recommendedPlanErrorCount int,

regressedPlanExecutionCount int,
regressedPlanCpuTimeAverage float,
recommendedPlanExecutionCount int,
recommendedPlanCpuTimeAverage float

) as planForceDetails;

I will break the results down into two photos to make them fit well in this blog post.

Free Tuning Recommendations with Automatic Tuning in SQL Server 2017

Free Tuning Recommendations with SQL Server 2017 (1/2)

Automatic Tuning Results in SQL Server 2017

Free Tuning Recommendations with SQL Server 2017 (2/2)

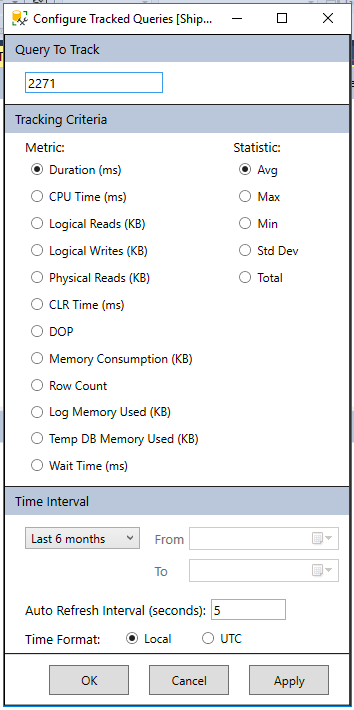
Now we know in the query store query_id 2271 has CPU time changing from 7,235ms to 26ms. That’s a big difference. Let’s take that query and look at its findings by using the tracked query report inside SSMS.

Query Store find history of a query

Find my Changed Query. Did the plans change?

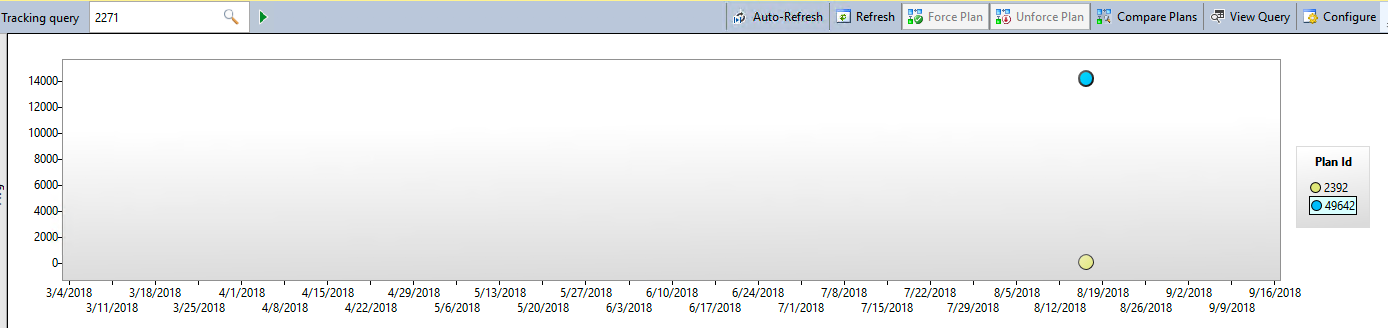
Here we can see the major difference between the two execution plans. One is averaging over 14 seconds in duration while the other is under a second.

Reviewing Query performance in Query Store

Query Store showing the performance difference between the two plans

Now we can select both plans on the screen above and look at the execution plans side by side inside of SSMS. When doing so, we see the common example of the optimizer determining if it is better to scan an index vs a seek with a key lookup.

Side by Side Execution Plan Review in SSMS.

Using SSMS to compare auto tuning recommended query.

To complete the example I want to point out that automatic tuning would lock in the index seek plan (Plan 2392). In SQL Server 2016 you can do this as well manually inside Query Store. With SQL Server 2017 it can be done automatically for you with Automatic Tuning. If you have ever woken up to slow performance due to an execution plan changing and performance going through the drain this might be a life saver.

If you would like to learn about performance tuning changes in SQL Server 2016 and 2017 sign up for our newsletter or catch me talking about these features at SQL Saturday Denver and SQL Saturday Pittsburgh this month.  If you need any help with tuning or upgrading contact us. We would love to chat with you!


The post SQL Server Automatic Tuning in the Real-World appeared first on SQL Server Consulting & Remote DBA Service.

September 10, 2018/by John Sterrett
https://procuresql.com/wp-content/uploads/2018/09/Procure-SQL-Automatic-Tuning-2.jpg 563 1093 John Sterrett /wp-content/uploads/2024/05/Data-Architecture-as-a-Service-with-ProcureSQL.png John Sterrett2018-09-10 03:08:112018-09-10 03:08:11Automatic Tuning in the Real-World
Join Our Newsletter
  Thank you for Signing Up
Please correct the marked field(s) below.
1,true,6,Contact Email,21,false,1,First Name,21,false,1,Last Name,2
Search Search

Blog Categories

  • $150 Challenge
  • Advice
  • Announcements
  • Artificial Intelligence
  • Awards
  • Azure Data Factory
  • C-Level
  • Cloud
  • Community
  • Conferences
  • Data Architecture
  • Data Integration
  • Data Intergration
  • Data Visualization
  • Data Warehousing
  • DBA 101
  • Design
  • Disaster Recovery or High Availability
  • Education
  • Fabric Dev Ops
  • Fabric Lakehouse
  • Fabric Lakehouses
  • Fabric Mirroring
  • Fabric Notebooks
  • Features
  • General
  • Health Checks
  • Lab
  • Microsoft Fabric
  • Microsoft Technologies
  • Newsletter
  • Performance Tuning
  • Power BI
  • ProcureSQL
  • Python
  • Reporting
  • Security
  • SQL Server
  • SQL Server
  • sql server 101
  • SQLServerPedia Syndication
  • syndication
  • The Blog
  • Uncategorized
  • Visual Studio Credit

Tags

#SQLFamily automatic tuning availability group azure backup Backups career Data Governance Data Loss Data Platform DBA Denver Differential Backup Disaster Recovery Fabric Fabric Architecture Full Backup High Availability Houston Marketing Database Administrator Microsoft Microsoft Fabric Microsoft SQL Server mirroring parameter sniffing PASS performance tuning Professional Development query store Recovery Recovery Model Restores Security SQL Saturday SQL Server SQL Server 2017 sql server 2019 SQL Server 2022 sql server 2025 SSMS System Databases Transaction Log Backup tsqltuesday Tuning Wait Stats

Archives

  • September 2026
  • August 2026
  • July 2026
  • June 2026
  • May 2026
  • April 2026
  • March 2026
  • February 2026
  • November 2025
  • October 2025
  • September 2025
  • July 2025
  • June 2025
  • May 2025
  • April 2025
  • March 2025
  • January 2025
  • December 2024
  • November 2024
  • October 2024
  • September 2024
  • August 2024
  • July 2024
  • June 2024
  • May 2024
  • February 2024
  • January 2024
  • November 2023
  • October 2023
  • March 2023
  • January 2023
  • May 2022
  • April 2022
  • November 2021
  • September 2020
  • August 2020
  • April 2020
  • March 2020
  • February 2020
  • January 2020
  • December 2019
  • November 2019
  • September 2019
  • July 2019
  • April 2019
  • November 2018
  • September 2018
  • August 2018
  • July 2018
  • June 2018
  • May 2018
  • April 2018
  • March 2018
  • February 2018
  • January 2018
  • November 2017
  • October 2017
  • August 2017
  • July 2017
  • June 2017
  • April 2017
  • December 2016
  • November 2016
  • October 2016
  • July 2016
© Copyright 2026 - ProcureSQL - 1464 East Whitestone Blvd., Suite 1902 Cedar Park, TX 78613, USA
  • Link to Facebook
  • Link to Instagram
  • Link to LinkedIn
  • Link to Youtube
  • Link to X
Scroll to top Scroll to top Scroll to top
Manage Consent
To provide the best experiences, we use technologies like cookies to store and/or access device information. Consenting to these technologies will allow us to process data such as browsing behavior or unique IDs on this site. Not consenting or withdrawing consent, may adversely affect certain features and functions.
Functional Always active
The technical storage or access is strictly necessary for the legitimate purpose of enabling the use of a specific service explicitly requested by the subscriber or user, or for the sole purpose of carrying out the transmission of a communication over an electronic communications network.
Preferences
The technical storage or access is necessary for the legitimate purpose of storing preferences that are not requested by the subscriber or user.
Statistics
The technical storage or access that is used exclusively for statistical purposes. The technical storage or access that is used exclusively for anonymous statistical purposes. Without a subpoena, voluntary compliance on the part of your Internet Service Provider, or additional records from a third party, information stored or retrieved for this purpose alone cannot usually be used to identify you.
Marketing
The technical storage or access is required to create user profiles to send advertising, or to track the user on a website or across several websites for similar marketing purposes.
  • Manage options
  • Manage services
  • Manage {vendor_count} vendors
  • Read more about these purposes
View preferences
  • {title}
  • {title}
  • {title}