Have you ever noticed that execution plans changed? Is your performance suffering due to the change? If so, Automatic Plan Correction is for you. In our previous blog post, we identified scalar function improvements,parameter sniffing and data skew. In this post, we are going to show you how SQL Server 2017 can automatically help improve your performance. This is done by changing executions plans to improve your performance.
How does Automatic Plan Correction work?
Great question. Go ahead and watch the short video below to see for yourself.
If you found this page you most likely either found yourself in the middle of a SQL Server parameter sniffing and/or data skew issue and have no idea how to get yourself out of this hole. In the eight-minute video below we go over exactly what parameter sniffing and data skew is and how you can identify it on your own.
SPOILER ALERT: Parameter sniffing is mostly an amazing thing that saves tons of CPU cycles. Like many DBA tasks, this usually only gets attention when expectations are not met. Most likely you have these issues in your database without even knowing it. See a real-world case where data skew was resolved with a customer using SQL Server 2017 without changing any code.
Learn how to identify parameter sniffing and data skew and fix it on your own.
How do we fix SQL Server parameter sniffing?
Now that you know what parameter sniffing and data skew is our next blog post will go over using Query Store and Automatic Tuningto enhance your performance automatically or manually. This will resolve queries that regressed due to parameter sniffing.
https://procuresql.com/wp-content/uploads/2018/09/Procure-SQL-Should-We-Compress-SQL-Server-Backups-1.jpg5601454John Sterrett/wp-content/uploads/2024/05/Data-Architecture-as-a-Service-with-ProcureSQL.pngJohn Sterrett2019-04-17 16:58:392019-04-17 16:58:39What is SQL Server parameter sniffing and data skew?
With SQL Server 2017 Microsoft improved the journey towards making your code go faster without any code changes required by your developers. SQL Server 2019 gives you more of this super cool black magic.
Today, we are going to show you the details of why scalar functions executions are changing and how you can make Scalar functions run faster if you are not on SQL Server 2019 (SPOILER ALERT: It will require some code changes)
Why are Scalar Functions Silent Performance Killers?
Scalar functions are silent performance killers because before SQL Sever 2019 you wouldn’t see them in execution plans or using set statistics which is how most people benchmark a queries performance. Below we have a video going over Scalar Functions and how to see the silent performance killer.
Hello SQL Server User, meet your silent but deadly performance killer.
How does SQL Server 2019 Make this better?
This is a great question. I am glad you asked.
If you saw the video above you know that scalar functions do row by row processing and you can see in the Profiler trace that the GetMaxProductQty_Scalar function was executed for all 504 rows in the product table.
In SQL Server 2019, the row by row processing will go to set based logic when possible. This is shown in the next video below in great detail.
Can you help me find more information on Scalar Function changes with SQL 2019?
YES! The following are some great extra reference articles I would highly recommend reviewing.
Aaron Bertrand who works with SentryOne has a great write up as well.
Can I have the source code and play with the demo?
Yes, I strongly encourage it. In fact, if you have any questions going through the demo and have questions feel free to ask me questions.
USE [master];
GO
ALTER DATABASE [AdventureWorks2012]
SET QUERY_STORE (OPERATION_MODE = READ_WRITE,
/* For demo purposes. Most likely don't want these settings in production! */
					DATA_FLUSH_INTERVAL_SECONDS = 60,
					QUERY_CAPTURE_MODE = ALL,
					INTERVAL_LENGTH_MINUTES = 1);
GO

USE [AdventureWorks2012];
GO
DBCC DROPCLEANBUFFERS; -- For demo to get PAGEIOLATCH waits
ALTER DATABASE CURRENT SET QUERY_STORE CLEAR ALL;

/*
How does scalar functions work before SQL Server 2019?
Lets see...
*/
USE [master]
GO
ALTER DATABASE [AdventureWorks2012] SET COMPATIBILITY_LEVEL = 120
GO

USE [AdventureWorks2012]
GO
select @@SPID

set statistics io on
set statistics time on
GO

/*** Makes demo go faster
CREATE INDEX idx_test ON Sales.SalesOrderDetailEnlarged (ProductID)
INCLUDE (OrderQty)
WITH (DATA_COMPRESSION = PAGE, ONLINE=ON)
***/

/* CleanUp - Remove functions for the demo
DROP IF EXISTS was added in SQL 2016
*/
USE [AdventureWorks2012]
GO
DROP FUNCTION IF EXISTS GetMaxProductQty_Scalar
DROP FUNCTION IF EXISTS GetMaxProductQty_Inline
GO

/* Now the fun begins... */
USE [AdventureWorks2012]
GO
CREATE FUNCTION GetMaxProductQty_Scalar
(
    @ProductId INT
)
RETURNS INT
AS
BEGIN
    DECLARE @maxQty INT

    SELECT @maxQty = MAX(sod.OrderQty)
    FROM Sales.SalesOrderDetailEnlarged sod
    WHERE sod.ProductId = @ProductId

    RETURN (@maxQty)
END


/* Clear all pages from memory
WARNING: Do not do this in production..
This gives us a senario where no pages or plans are in memory. */
CHECKPOINT
DBCC DROPCLEANBUFFERS;
ALTER DATABASE SCOPED CONFIGURATION CLEAR PROCEDURE_CACHE;
/* New in SQL Server 2016 and SQL Azure.
This removes plan cache for the database you are in.
Can use this to replace DBCC FREEPROCCACHE which would
remove plan cache for ALL databases */


/* TODO: LOAD PROFILER - Show ROW BY ROW Function Calls */
/* Row By Row Processing - Scalar Function */
SELECT
    ProductId,
    dbo.GetMaxProductQty_Scalar(ProductId) As MaxQty
FROM Production.Product
ORDER BY 2 DESC

/* Where is function calls? Didn't we also hit SalesOrderDetailEnlarged?

(504 row(s) affected)
Table 'Product'. Scan count 1, logical reads 4, physical reads 1, read-ahead reads 2, lob logical reads 0, lob physical reads 0, lob read-ahead reads 0.

  SQL Server Execution Times:
   CPU time = 1750 ms,  elapsed time = 1958 ms.
*/

/** Lets look at SQL Server 2019 CTP 2.4 Inline Scalar Functions. **/
USE [master]
GO
ALTER DATABASE [AdventureWorks2012] SET COMPATIBILITY_LEVEL = 150
GO


/* Clear all pages from memory
WARNING: Do not do this in production..
This gives us a senario where no pages or plans are in memory. */
USE [AdventureWorks2012]
GO
CHECKPOINT
DBCC DROPCLEANBUFFERS;
ALTER DATABASE SCOPED CONFIGURATION CLEAR PROCEDURE_CACHE;
GO

/* TODO: LOAD PROFILER - Show ROW BY ROW Function Calls */
/* Row By Row Processing - Scalar Function */
USE [AdventureWorks2012]
GO
SELECT
    ProductId,
    dbo.GetMaxProductQty_Scalar(ProductId) As MaxQty
FROM Production.Product
ORDER BY 2 DESC
GO
/**** We now SEE SalesOrderDetailEnlarged in plan and Set Statistics IO.
WE DIDN'T SEE THIS BEFORE SQL SERVER 2019  ****


(504 rows affected)
Table 'Worktable'. Scan count 0, logical reads 0, physical reads 0, read-ahead reads 0, lob logical reads 0, lob physical reads 0, lob read-ahead reads 0.
Table 'SalesOrderDetailEnlarged'. Scan count 504, logical reads 11930, physical reads 2, read-ahead reads 8341, lob logical reads 0, lob physical reads 0, lob read-ahead reads 0.
Table 'Product'. Scan count 1, logical reads 4, physical reads 1, read-ahead reads 0, lob logical reads 0, lob physical reads 0, lob read-ahead reads 0.

 SQL Server Execution Times:
   CPU time = 2156 ms,  elapsed time = 2494 ms.

*/


/*** HOW CAN WE MAKE THIS BETTER
		if we are NOT on SQL SERVER 2019? ***/
USE [master]
GO
ALTER DATABASE [AdventureWorks2012] SET COMPATIBILITY_LEVEL = 140
GO


/*
Utilize a table value function
instead of scalar function where possible.

*/
USE [AdventureWorks2012]
GO
CREATE FUNCTION GetMaxProductQty_Inline
(
    @ProductId INT
)
RETURNS TABLE
AS
    RETURN
    (
        SELECT MAX(sode.OrderQty) AS maxqty
        FROM Sales.SalesOrderDetailEnlarged sode
        WHERE sode.ProductId = @ProductId
    )
GO

CHECKPOINT
DBCC DROPCLEANBUFFERS;
DBCC FREEPROCCACHE;

/*
WHAT is APPLY?
https://technet.microsoft.com/en-us/library/ms175156(v=sql.105).aspx
The APPLY operator allows you to invoke a table-valued function
for each row returned by an outer table expression of a query.
The table-valued function acts as the right input and the outer
table expression acts as the left input. The right input is
evaluated for each row from the left input and the rows produced
are combined for the final output.
*/

SELECT  p.ProductId,
		MaxQty
FROM Production.Product p
CROSS APPLY dbo.GetMaxProductQty_Inline(p.ProductId) tvf
ORDER BY 2 DESC


/*
(504 rows affected)
Table 'Product'. Scan count 2, logical reads 40, physical reads 0, read-ahead reads 0, lob logical reads 0, lob physical reads 0, lob read-ahead reads 0.
Table 'SalesOrderDetailEnlarged'. Scan count 3, logical reads 8230, physical reads 0, read-ahead reads 0, lob logical reads 0, lob physical reads 0, lob read-ahead reads 0.
Table 'Worktable'. Scan count 0, logical reads 0, physical reads 0, read-ahead reads 0, lob logical reads 0, lob physical reads 0, lob read-ahead reads 0.

 SQL Server Execution Times:
   CPU time = 3015 ms,  elapsed time = 2018 ms.

*/


CHECKPOINT
DBCC DROPCLEANBUFFERS;
DBCC FREEPROCCACHE;

/* In this case, we can just join against the two tables */
SELECT p.ProductId, MAX(sod.OrderQty)
FROM Sales.SalesOrderDetailEnlarged sod
RIGHT JOIN Production.Product p ON sod.ProductID = p.ProductID
GROUP BY p.ProductID
ORDER BY 2 DESC

/* (504 rows affected)
Table 'Product'. Scan count 3, logical reads 40, physical reads 1, read-ahead reads 14, lob logical reads 0, lob physical reads 0, lob read-ahead reads 0.
Table 'SalesOrderDetailEnlarged'. Scan count 3, logical reads 8226, physical reads 1, read-ahead reads 8317, lob logical reads 0, lob physical reads 0, lob read-ahead reads 0.
Table 'Worktable'. Scan count 0, logical reads 0, physical reads 0, read-ahead reads 0, lob logical reads 0, lob physical reads 0, lob read-ahead reads 0.

 SQL Server Execution Times:
   CPU time = 3048 ms,  elapsed time = 2122 ms.

*/

/* Index to improve - Columnstore Index */
USE [AdventureWorks2012]
GO
CREATE NONCLUSTERED COLUMNSTORE INDEX nccidx_SalesOrderDE on Sales.SalesOrderDetailEnlarged (ProductID, OrderQty)
GO

USE [AdventureWorks2012]
GO
CHECKPOINT
DBCC DROPCLEANBUFFERS;
DBCC FREEPROCCACHE;
GO

SELECT  ProductId,
		MaxQty
FROM Production.Product
CROSS APPLY dbo.GetMaxProductQty_Inline(ProductId) MaxQty
ORDER BY 2 DESC

/*
(504 rows affected)
Table 'SalesOrderDetailEnlarged'. Scan count 2, logical reads 0, physical reads 0, read-ahead reads 0, lob logical reads 8251, lob physical reads 13, lob read-ahead reads 30209.
Table 'SalesOrderDetailEnlarged'. Segment reads 6, segment skipped 0.
Table 'Worktable'. Scan count 0, logical reads 0, physical reads 0, read-ahead reads 0, lob logical reads 0, lob physical reads 0, lob read-ahead reads 0.
Table 'Product'. Scan count 1, logical reads 4, physical reads 1, read-ahead reads 0, lob logical reads 0, lob physical reads 0, lob read-ahead reads 0.

 SQL Server Execution Times:
   CPU time = 47 ms,  elapsed time = 724 ms.
*/


/*** Does Non Clustered Columnstore index change anything
	With SQL 2019?

	We wouldn't be doing this if it didnt ;-)
	****/
USE [master]
GO
ALTER DATABASE [AdventureWorks2012] SET COMPATIBILITY_LEVEL = 150
GO


/* Clear all pages from memory
WARNING: Do not do this in production..
This gives us a senario where no pages or plans are in memory. */
USE [AdventureWorks2012]
GO
CHECKPOINT
DBCC DROPCLEANBUFFERS;
ALTER DATABASE SCOPED CONFIGURATION CLEAR PROCEDURE_CACHE;
GO

USE [AdventureWorks2012]
GO
SELECT
    ProductId,
    dbo.GetMaxProductQty_Scalar(ProductId) As MaxQty
FROM Production.Product
ORDER BY 2 DESC

/* YOUR MILAGE MIGHT VERY....
(504 rows affected)
Table 'Worktable'. Scan count 504, logical reads 14546904, physical reads 0, read-ahead reads 0, lob logical reads 0, lob physical reads 0, lob read-ahead reads 0.
Table 'Workfile'. Scan count 0, logical reads 0, physical reads 0, read-ahead reads 0, lob logical reads 0, lob physical reads 0, lob read-ahead reads 0.
Table 'SalesOrderDetailEnlarged'. Scan count 2, logical reads 0, physical reads 0, read-ahead reads 0, lob logical reads 4006, lob physical reads 0, lob read-ahead reads 0.
Table 'SalesOrderDetailEnlarged'. Segment reads 6, segment skipped 0.
Table 'Product'. Scan count 1, logical reads 4, physical reads 0, read-ahead reads 0, lob logical reads 0, lob physical reads 0, lob read-ahead reads 0.

 SQL Server Execution Times:
   CPU time = 31203 ms,  elapsed time = 31640 ms.


*/


/* ---------- > CLEANUP < ----------- */
USE [AdventureWorks2012]
GO
DROP FUNCTION IF EXISTS GetMaxProductQty_Scalar
DROP FUNCTION IF EXISTS GetMaxProductQty_Inline
DROP INDEX IF EXISTS idx_SalesOrderDE_ProductID_Include1 on Sales.SalesOrderDetailEnlarged
DROP INDEX IF EXISTS nccidx_SalesOrderDE on Sales.SalesOrderDetailEnlarged
GO
I had a blast speaking at SQL Saturday Denver. To help everyone moving to SQL Server 2017 I have included my slides and demo code below. If you end up having any questions with the code or need help feel free to contact me.
In SQL Server 2016 we saw Query Store. Query Store was a game changer to help database administrators identify troublesome queries. Query Store helps DBAs make those queries run faster. Microsoft’s marketing team even jumped on to help coin the phrase, “SQL Server It Just Runs Faster.” With SQL Server 2017, this started to get even better with automatic tuning. Don’t worry database administrators. Automatic Tuning will just enhance your career and not replace it.
SQL Server 2017 Automatic Tuning looks for queries where execution plans change and performance regresses. This feature depends on Query Store being enabled. Note, even if you don’t turn on Automatic Tuning you still get the benefits of having access to the data. That is right. Automatic Tuning would tell you what it would do if it was enabled. Think of this as free performance tuning training. Go look at the DMVs and try to understand why the optimizer would want to lock in an execution plan. We will actually go through a real-world example:
Automatic Tuning with SQL Server 2017
First, let’s take a quick look at the output of the data. You can find the query and results we will focus on below.
SELECT reason, score,
script = JSON_VALUE(details, '$.implementationDetails.script'),
planForceDetails.*,
estimated_gain = (regressedPlanExecutionCount+recommendedPlanExecutionCount)
*(regressedPlanCpuTimeAverage-recommendedPlanCpuTimeAverage)/1000000,
error_prone = IIF(regressedPlanErrorCount>recommendedPlanErrorCount, 'YES','NO')
FROM sys.dm_db_tuning_recommendations
CROSS APPLY OPENJSON (Details, '$.planForceDetails')
WITH ( [query_id] int '$.queryId',
[current plan_id] int '$.regressedPlanId',
[recommended plan_id] int '$.recommendedPlanId',

regressedPlanErrorCount int,
recommendedPlanErrorCount int,

regressedPlanExecutionCount int,
regressedPlanCpuTimeAverage float,
recommendedPlanExecutionCount int,
recommendedPlanCpuTimeAverage float

) as planForceDetails;
I will break the results down into two photos to make them fit well in this blog post.
Free Tuning Recommendations with SQL Server 2017 (1/2)
Free Tuning Recommendations with SQL Server 2017 (2/2)
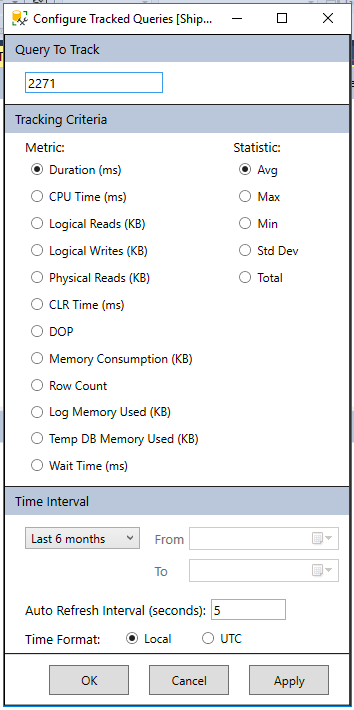
Now we know in the query store query_id 2271 has CPU time changing from 7,235ms to 26ms. That’s a big difference. Let’s take that query and look at its findings by using the tracked query report inside SSMS.
Find my Changed Query. Did the plans change?
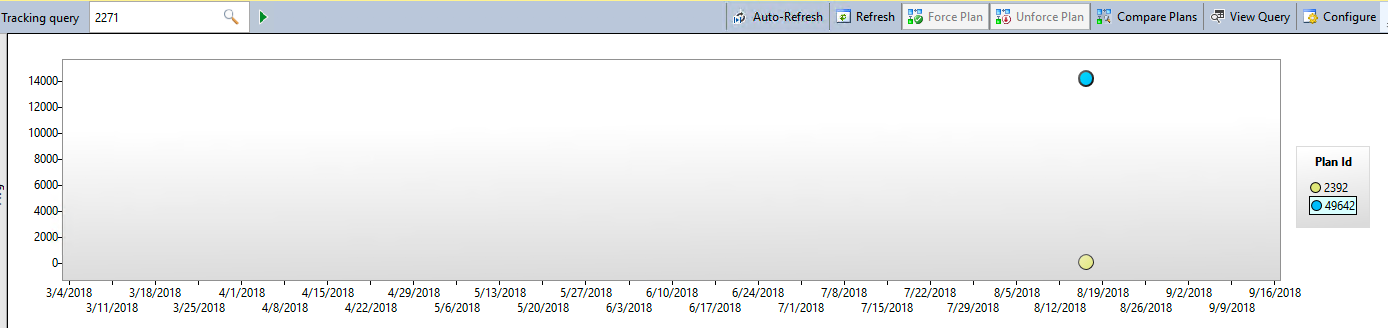
Here we can see the major difference between the two execution plans. One is averaging over 14 seconds in duration while the other is under a second.
Query Store showing the performance difference between the two plans
Now we can select both plans on the screen above and look at the execution plans side by side inside of SSMS. When doing so, we see the common example of the optimizer determining if it is better to scan an index vs a seek with a key lookup.
Using SSMS to compare auto tuning recommended query.
To complete the example I want to point out that automatic tuning would lock in the index seek plan (Plan 2392). In SQL Server 2016 you can do this as well manually inside Query Store. With SQL Server 2017 it can be done automatically for you with Automatic Tuning. If you have ever woken up to slow performance due to an execution plan changing and performance going through the drain this might be a life saver.
https://procuresql.com/wp-content/uploads/2018/09/Procure-SQL-Automatic-Tuning-2.jpg5631093John Sterrett/wp-content/uploads/2024/05/Data-Architecture-as-a-Service-with-ProcureSQL.pngJohn Sterrett2018-09-10 03:08:112018-09-10 03:08:11Automatic Tuning in the Real-World
To provide the best experiences, we use technologies like cookies to store and/or access device information. Consenting to these technologies will allow us to process data such as browsing behavior or unique IDs on this site. Not consenting or withdrawing consent, may adversely affect certain features and functions.
Functional
Always active
The technical storage or access is strictly necessary for the legitimate purpose of enabling the use of a specific service explicitly requested by the subscriber or user, or for the sole purpose of carrying out the transmission of a communication over an electronic communications network.
Preferences
The technical storage or access is necessary for the legitimate purpose of storing preferences that are not requested by the subscriber or user.
Statistics
The technical storage or access that is used exclusively for statistical purposes.The technical storage or access that is used exclusively for anonymous statistical purposes. Without a subpoena, voluntary compliance on the part of your Internet Service Provider, or additional records from a third party, information stored or retrieved for this purpose alone cannot usually be used to identify you.
Marketing
The technical storage or access is required to create user profiles to send advertising, or to track the user on a website or across several websites for similar marketing purposes.