In five minutes, Justin gives you a Microsoft Fabric overview to help you ingest, process, store, monitor, and govern your data with Microsoft’s new analytics tool. He will discuss user personas like Data Engineering and Data Science within Microsoft Fabric and how the personas will use tools like Data Activator, Power BI, Data Factory, Real-Time Analytics, Notebooks, Spark, Lakehouse, and more.
In five minutes, Justin at Procure SQL breaks down how Microsoft Fabric tools help you ingest, process, store, monitor, and govern your data with Microsoft’s new analytics tool.
Got Microsoft Fabric or Analytics Questions?
We would love to discuss your questions from watching this Microsoft Fabric overview video or anything related to the Microsoft Data Platform. Fill out the form below, and we will be in touch soon.
https://procuresql.com/wp-content/uploads/2018/09/Procure-SQL-RTO-RPO-1.jpg5611076Justin Cunningham/wp-content/uploads/2024/05/Data-Architecture-as-a-Service-with-ProcureSQL.pngJustin Cunningham2024-02-06 21:39:082024-02-06 21:39:08Microsoft Fabric Overview in Five Minutes
This week, John asked, “Can you query data inside a lakehouse using SQL Server Management Studio?
Yes, did you know you could query your data inside a Microsoft Fabric Lakehouse with SSMS (SQL Server Management Studio)? John didn’t so Justin Cunninham shows you how to leverage SSMS with your data in four minutes In this data architect tip.
If you find yourself needing some Data Architect as a service contact us. If you enjoyed this video, sign up for our newsletter.
https://procuresql.com/wp-content/uploads/2018/09/Procure-SQL-Do-I-need-a-Backup-System-Database-1-1.jpg5631090Justin Cunningham/wp-content/uploads/2024/05/Data-Architecture-as-a-Service-with-ProcureSQL.pngJustin Cunningham2024-01-10 05:22:272024-01-10 05:22:27Query your Lakehouse in Fabric with SSMS
Accelerated Database Recovery. How did we get here?
While Accelerated Database Recovery (ADR) is new, the need and purpose of improving the time to recover is always relevant. There are many ways that a database can crash and need to recover. Maybe you find yourself here from something more severe like hardware failure, perhaps it was only a reboot and when things started to come back you see databases stuck in an “In Recovery” state. I personally have been bitten by a log running transaction rolling back a few times. Regardless, the scenario is scary because you need to wait for the recovery process to finish or restore from back ups to get out of this situation.
SQL Server is taking a minute to go through the database files to determine what, if anything, needs to be fixed. It will go through the mdf and ldf files, create some working tables (Dirty Page Table and Active Transaction Table) for itself to track what needs done and go forward from there.
Redo Phase
SQL Server is going through and applying every valid modification tracked in the transaction log file/s (how many files needed would be shown in the DPT (Dirty Page Table) as the minimum LSN required). This process is cleaning out the DPT so that all dirty pages that belong to a committed transaction are being applied to disk. In my experience this part takes the longest, but that heavily depends on your transaction log size and number of VLFs.
Undo Phase
Anything that was uncommitted and put into the ATT (Active Transaction Table) is now being reviewed and rolled back so long as it doesn’t affect database integrity. Once these items are rolled back, the database would enter the online state again and become available for reads and writes.
What’s so great about Accelerated Database Recovery?
What if I told you that long running transaction wait times could be eliminated and we could still process the 3 phases of recovery, but at a much faster pace? That is the high level benefit of ADR. ADR brings us the sLog, persisted version store (PVS), and logical reverts. sLog tracks non-versioned operations in memory and the latter 2 phases of the recovery process use this log to process things from the oldest uncommitted transaction up to the latest checkpoint. Since everything is in memory and we are only concerned with non-versioned operations (DDL operations, bulk queries), these steps can process at a much quicker pace. PVS is similar to the version store but gets stored in the target database of the transaction instead of inside tempdb, which helps out the other new concept of logical revert. Logical revert is using PVS to avoid lengthy rollback wait time and locks and instead aborting the transaction all together and just using the previous row version in PVS.
The new 3 phases in SQL Server
Analysis Phase
SQL Server still processes this phase in the same manner it did before, but adds in the step of constructing the sLog for processing in the next 2 steps.
Redo Phase
The accelerated database recovery redo phase is now broken into 2 parts
Part 1
In the first accelerated database recovery redo phase part we complete our redo transactions required in the sLog starting at the oldest uncommitted transaction and go up to the latest database checkpoint. This part typically completes very quickly because we are still only looing at non-versioned operations.
Part 2
After reaching the latest database checkpoint, the engine then swaps over to the transaction log and continues performing redo transactions until it gets to the current time in the log.
Undo Phase
The undo phase is the big winner in accelerated database recovery as everything done in undo can happen from the sLog and also perform quick rollbacks using the PVS and logical revert functionality.
Things to watch out for when using Accelerated Database Recovery
While accelerated database recovery does have many positives, there are some costs associated to them. The largest cost is the increase in size for all data files for databases that have this feature enabled as you are now storing previous versions of changed rows in the user database. Another cost to consider is the additional compute power that will be consumed maintaining the rows in PVS.
Want to save money, validate performance, and make sure you don’t have errors while migrating to Azure SQL Database, Azure SQL Managed Instance, SQL Server RDS in Amazon AWS? In this video, you will learn how to use the Data Experimentation Assistant to replay and compare your on-premise or cloud SQL Server workloads on-demand. First, you will learn how to capture a workload on-premise or in the cloud. Next, you will master replaying your workload on-demand as needed. Finally, you will do an analysis of comparing a baseline workload and another workload with your changes.
Replay in the Cloud Video
Slidedeck
Recommended Reads
If you liked this video, check out the following other resources.
https://procuresql.com/wp-content/uploads/2019/03/Procure-SQL-Automatic-Tuning-1.jpg5631093JohnSterrett/wp-content/uploads/2024/05/Data-Architecture-as-a-Service-with-ProcureSQL.pngJohnSterrett2020-09-11 14:10:322020-09-11 14:10:32Replay in the Cloud
I am a consultant in Austin who can help make your data go fast, be secure and highly available. When I am engaged in a performance tuning project priority #1 isn’t to make sure your data go faster. Priority #1 is to make sure we get the same result sets while making your data go faster.
Free SQL Data Compare with T-SQL?
There are several tools out there that can be used to compare data. Today, I want to share how you can quickly do this on your own with T-SQL!
Let’s simplify the process. Our goal is to check two temp tables and validate if any of the data is different. This would include inserts, updates, and deletes. For this example, I will just do a dump of Sales.SalesOrderDetail in AdventureWorks into two temp tables as shown below.
SELECT * INTO #Tmp1
FROM Sales.SalesOrderDetail SELECT * INTO #Tmp2
FROM Sales.SalesOrderDetail
Now we shouldn’t see any differences since we used the same table to create both temp tables. We are going to use two different SQL operators to compare these two temp tables while applying some data changes. We will focus on the UNION ALL and EXCEPT operators.
The Power of EXCEPT
Except is an underrated and underused SQL operation. In a nutshell, it will give you the results of the first query that are different from the next query. So, if the data of any column in #tmp1 is different from #tmp2 or if the row doesn’t exist in #tmp2 but is in #tmp1 it will get returned.
SELECT * FROM #Tmp1
EXCEPT SELECT * FROM #Tmp2
Let’s go ahead and modify a column in #Tmp1 so you can see how this works. We are going to set OrderQty to five when SalesOrderId is 45313 and SalesOrderDetailId is 6210. This will change just one column in one row. We will then select these columns from both temp tables to see the change.
This is how most people would start using T-SQL to identify changes in data.
UPDATE #Tmp1 SET OrderQty = 5 WHERE SalesOrderID = 45313 AND SalesOrderDetailID = 6210 SELECT SalesOrderId, SalesOrderDetailID, OrderQty FROM #Tmp1 WHERE SalesOrderID = 45313 AND SalesOrderDetailID = 6210 SELECT SalesOrderId, SalesOrderDetailID, OrderQty FROM #Tmp2 WHERE SalesOrderID = 45313 AND SalesOrderDetailID = 6210
Finding Data Changes The Easy Way
Selecting the two tables is easy if we know what change occurred and there aren’t many changes. This can get complicated quickly. Therefore, if we just want to quickly know if we have differences lets take a look at my goto method using EXCEPT. To make this example easier to read instead of using “SELECT *” I will just focus on columns that are changing. In a real example, I would want to know if any columns changed.
SELECT SalesOrderId, SalesOrderDetailID, OrderQty FROM #Tmp1
EXCEPT SELECT SalesOrderId, SalesOrderDetailID, OrderQty FROM #Tmp2
If an insert or a column change occurs in #tmp1 we will see it in our EXCEPT SQL statement. This isn’t true if the change is only in #tmp2.
For example, an insert in #tmp2 or delete in #tmp1 would not be shown. To see this we would have to switch the temp tables in the EXCEPT clause as shown below.
INSERT INTO #tmp2 (SalesOrderId, ProductID, SpecialOfferID, OrderQty, UnitPrice, UnitPriceDiscount,LineTotal, rowguid, ModifiedDate)
VALUES (45313, 1, 3, 1,1.25,0,
1.25*1, NEWID(), GETDATE()) DELETE FROM #Tmp1
WHERE SalesOrderID = 45313 AND SalesOrderDetailID = 6211 SELECT SalesOrderId, SalesOrderDetailID, OrderQty FROM #Tmp1
EXCEPT SELECT SalesOrderId, SalesOrderDetailID, OrderQty FROM #Tmp2
/* We will now see our insert and delete */
SELECT SalesOrderId, SalesOrderDetailID, OrderQty FROM #Tmp2
EXCEPT SELECT SalesOrderId, SalesOrderDetailID, OrderQty FROM #Tmp1
Our first except shows us data in #tmp1 that is not in #tmp2 because the OrderQty column changed in #tmp1. The second EXCEPT shows us data in #tmp2 that isn’t in #tmp1 because of our insert into #tmp2 and also our delete from #tmp1 would be found in #tmp2 but not #tmp1.
UNION ALL for the Win!
To wrap this up now we can include a UNION ALL operation between the two EXCEPT operations. This would get us any data changes to the columns selected from the temp tables.
SELECT SalesOrderId, SalesOrderDetailID, OrderQty FROM #Tmp1
EXCEPT SELECT SalesOrderId, SalesOrderDetailID, OrderQty FROM #Tmp2
UNION ALL
SELECT SalesOrderId, SalesOrderDetailID, OrderQty FROM #Tmp2
EXCEPT SELECT SalesOrderId, SalesOrderDetailID, OrderQty FROM #Tmp1
Typically, I need to verify is the data before and after is the same. This is a quick and easy way to get that answer. Now I know you might want to take this to the next level. You might be thinking how do I just get the unique key for the table and columns that changed. I will leave that as an exercise for you.
This month’s T-SQL Tuesday is hosted by Tracy Boggiano. Tracy invites us all to write about adopting Query Store. Today, I wanted to share my favorite but a very unique way I use the Query Store for Workload Replays.
You can read more about the invite in detail by clicking on the T-SQL Tuesday logo in this post.
Today, I wanted to talk about my least favorite part of replaying workloads. It’s having an extended event or server-side trace running during a workload replay only so we can compare the results at a query-level when the replay is finished. Now, this might seem like a trivial thing but when you have workloads over 10k batch requests/sec this can consume terabytes of data quickly. The worst part is waiting to read all the data, slice and dice the data for analysis.
Starting with SQL Server 2016 there is a better and faster way to go! You can replace your extended event or server-side trace with Query Store captured data. Today, I will show you how to use the Query Store for the same purpose.
Different Settings
Keep in mind our goal here is very different from the typical use case for using the Query Store. We want to capture metrics for all the queries executed during a workload replay. Nothing more and nothing less.
If we have the runtime results for multiple replays we can then easily compare the workload performance between the workload replays.
Most of our changes from the regular Query Store best practices are shown below:
Max Size (MB) – Need to make sure there is enough space to capture your whole workload. This size will vary by how much workload is being replayed.
Query Store Capture Mode set to All. Normally, not ideal, but remember we want to capture metrics for our whole workload being replayed.
Size Based Cleanup Mode set Off – Yup, we don’t want to lose our workload data that is capture until we persist in our ideal form. More on this later.
The Capture Process
Now, this is where you would use Database Experimentation Assistant (DEA), Distributed Replay or some other process to replay your consistent workload in an isolated non-production environment. This subject we will cover in another future post. For now, we will just have two replays called “Baseline” and “Change”. This simulates a baseline replay with no schema changes and then another change replay with a change introduced in the schema.
To capture our workload we just enable the Query store with our settings mentioned above and also clear out the query store right before our workload replay starts to help ensure we are just capturing our workload.
USE [master]
GO
ALTER DATABASE [YourDatabase] SET QUERY_STORE = ON
GO
ALTER DATABASE [YourDatabase] SET QUERY_STORE (OPERATION_MODE = READ_ONLY, MAX_STORAGE_SIZE_MB = 10000, QUERY_CAPTURE_MODE = AUTO, SIZE_BASED_CLEANUP_MODE = OFF)
GO
ALTER DATABASE [YourDatabase] SET QUERY_STORE CLEAR
GO
Stop Capturing Query Store Data
Once your replay is finished we will want to disable the query store from writing data into the query store. We want the least amount of non-workload data inside of the Query Store when we are using it for the sole purpose of comparing workloads.
USE [master]
GO
ALTER DATABASE [YourDatabase] SET QUERY_STORE (OPERATION_MODE = READ_ONLY)
GO
Prepare Query Store Data for Long-Term Analysis
Now for smaller workloads, one might be happy with utilizing DBCC CLONEDATABASE to have a schema-copy of their workload with Query Store data persisted. This is perfectly fine. With bigger workloads being captured I have noticed there are ways to improve the performance of query store when doing analysis of the query store data. For example, clustered columnstore indexes can be very helpful for performance and compacity. Therefore, I like to have a schema for each replay and import the data. The following is a quick example of setting up a schema for a “baseline” replay and a “change” replay.
CREATE DATABASE [DBA]
GO
use [DBA]
GO
CREATE SCHEMA Baseline;
GO
CREATE SCHEMA Compare;
GO
Next, we will import our captured data from our baseline replay that’s in our read-only query store database. I also like to have a baked-in aggregate of metrics for reads, writes, duration and CPU at the query level.
use [YourDatabase]
GO
/* Load Data */
SELECT * INTO DBA.Baseline.query_store_runtime_stats FROM sys.query_store_runtime_stats; SELECT * INTO DBA.Baseline.query_store_runtime_stats_interval from sys.query_store_runtime_stats_interval; select * INTO DBA.Baseline.query_store_plan from sys.query_store_plan; select * INTO DBA.Baseline.query_store_query
from sys.query_store_query; select * INTO DBA.Baseline.query_store_query_text
from sys.query_store_query_text;
/* Addition for SQL 2017 */
select * INTO DBA.Baseline.query_store_wait_stats from sys.query_store_wait_stats use [DBA]
GO SELECT SUM(Count_executions) AS TotalExecutions,
SUM(Count_executions*avg_duration) AS TotalDuration,
SUM(Count_executions*avg_logical_io_reads) AS TotalReads,
SUM(Count_executions*avg_logical_io_writes) AS TotalWrites,
SUM(count_executions*avg_cpu_time) AS TotalCPU,
query_hash
INTO Baseline.QueryResults
FROM Baseline.query_store_runtime_stats rs
JOIN Baseline.query_store_plan p ON rs.plan_id = p.plan_id
JOIN Baseline.query_store_query q ON p.query_id = q.query_id
GROUP BY q.query_hash
Next, we would reset the database to our starting position and add our query store settings as mentioned above in this blog post and replay or workload again. This time, we would dump our data into the “change” schema
use [YourDatabase]
GO
/* Load Data */
SELECT * INTO DBA.Compare.query_store_runtime_stats FROM sys.query_store_runtime_stats; SELECT * INTO DBA.Compare.query_store_runtime_stats_interval from sys.query_store_runtime_stats_interval; select * INTO DBA.Compare.query_store_plan from sys.query_store_plan; select * INTO DBA.Compare.query_store_query
from sys.query_store_query; select * INTO DBA.Compare.query_store_query_text
from sys.query_store_query_text; select * INTO DBA.Compare.query_store_wait_stats from sys.query_store_wait_stats use [DBA]
GO SELECT SUM(Count_executions) AS TotalExecutions,
SUM(Count_executions*avg_duration) AS TotalDuration,
SUM(Count_executions*avg_logical_io_reads) AS TotalReads,
SUM(Count_executions*avg_logical_io_writes) AS TotalWrites,
SUM(count_executions*avg_cpu_time) AS TotalCPU,
query_hash
INTO Compare.QueryResults
FROM Compare.query_store_runtime_stats rs
JOIN Compare.query_store_plan p ON rs.plan_id = p.plan_id
JOIN Compare.query_store_query q ON p.query_id = q.query_id
GROUP BY q.query_hash
Comparing Workload Results
Now that we have our two workloads imported we can now compare to see how the workload changed per query. I will break this down into two quick steps. First, get deltas per query. Second, get totals for how many times a query might be different in the query store. More on this a little later in the post.
/* Query Store Results */
use [DBA]
GO SELECT DISTINCT c.TotalExecutions - b.TotalExecutions AS ExecutionDelta,
c.TotalExecutions AS CompareExecutions,
b.TotalExecutions AS BaselineExecutions,
c.TotalDuration - b.TotalDuration AS DurationDelta,
c.TotalCPU - b.TotalCPU AS CPUDelta,
c.TotalReads - b.TotalReads AS ReadDelta,
c.TotalWrites - b.TotalWrites AS WriteDelta,
c.TotalReads AS CompareReads,
b.TotalReads AS BaselineReads,
c.TotalCPU AS CompareCPU,
b.TotalCPU AS BaselineCPU,
c.TotalDuration AS CompareDuration,
b.TotalDuration AS BaselineDuration,
c.query_hash
--q.query_sql_text
INTO #CTE
FROM Baseline.QueryResults b
JOIN Compare.QueryResults c ON b.query_hash = c.query_hash select COUNT(query_sql_text) AS QueryCount, MAX(query_sql_text) query_sql_text, MIN(query_id) MinQueryID, qsq.query_hash
INTO #Compare
from Compare.query_store_query qsq
JOIN Compare.query_store_query_text q ON qsq.query_text_id = q.query_text_id where qsq.is_internal_query = 0
GROUP BY query_hash select COUNT(query_sql_text) AS QueryCount, MAX(query_sql_text) query_sql_text, MIN(query_id) MinQueryID, qsq.query_hash
INTO #Baseline
from Baseline.query_store_query qsq
JOIN Baseline.query_store_query_text q ON qsq.query_text_id = q.query_text_id where qsq.is_internal_query = 0
GROUP BY query_hash select cte.*
, a.QueryCount AS Compare_QueryCount
, b.QueryCount AS Baseline_QueryCount
, a.MinQueryID AS Compare_MinQueryID
, b.MinQueryID AS Baseline_MinQueryID
, a.query_sql_text
FROM #CTE cte JOIN #Compare a on cte.query_hash = a.query_hash
JOIN #Baseline b on cte.query_hash = b.query_hash
WHERE 1=1
AND ExecutionDelta = 0
ORDER BY ReadDelta ASC
Query Store for Workload Replays
Lessons Learned Along the Way!
Initially, working with the query store I thought query_id was going to be my best friend. I quickly learned that my old friend query_hash is more helpful for multiple reasons. One, I can easily compare queries between different replays. That’s right now all workload replays get you the same query_id even when the workload is the exact same being replayed. Two, I can compare them with different databases as well. Finally, query_hash is very helpful with ad-hoc workloads as I can aggregate all the different query_ids that have the same query hash.
/wp-content/uploads/2024/05/Data-Architecture-as-a-Service-with-ProcureSQL.png00JohnSterrett/wp-content/uploads/2024/05/Data-Architecture-as-a-Service-with-ProcureSQL.pngJohnSterrett2020-03-11 00:36:382020-03-11 00:36:38Query Store for Workload Replays
I recently spoke at a conference and was asked what is the easiest way to import databases to Azure SQL Database. Therefore, I wanted to share how I do this with DBATools.io. You can use the same code to just export if you need a local copy of an Azure SQL database as well.
Import-Module dbatools -Force
<# Variables #>
$BackupPath = "C:\Demo\AzureSQL\Bacpac" #folder location for backups
$SourceInstance = "sql2019\sql2016"
$DBName = "AdventureWorksLT2012"
$AzureDestInstance = "procuresqlsc.database.windows.net"
$DBNameDest = $DBName <# backpac options for import and export #>
$option = New-DbaDacOption -Type Bacpac -Action Export
$option.CommandTimeout = 0 $option2 = New-DbaDacOption -Type Bacpac -Action Publish
$option2.CommandTimeout = 0 <# The following assums Azure SQL Database exists and is empty Azure will create database by default if it doesn't exist #>
$bacpac = Export-DbaDacPackage -Type Bacpac -DacOption $option -Path `
$BackupPath -SqlInstance $SourceInstance -Database $DBName Publish-DbaDacPackage -Type Bacpac -SqlInstance `
$AzureDestInstance -Database $DBNameDest -Path $bacpac.path ` -DacOption $option2 -SqlCredential username
What Is my Performance Tier?
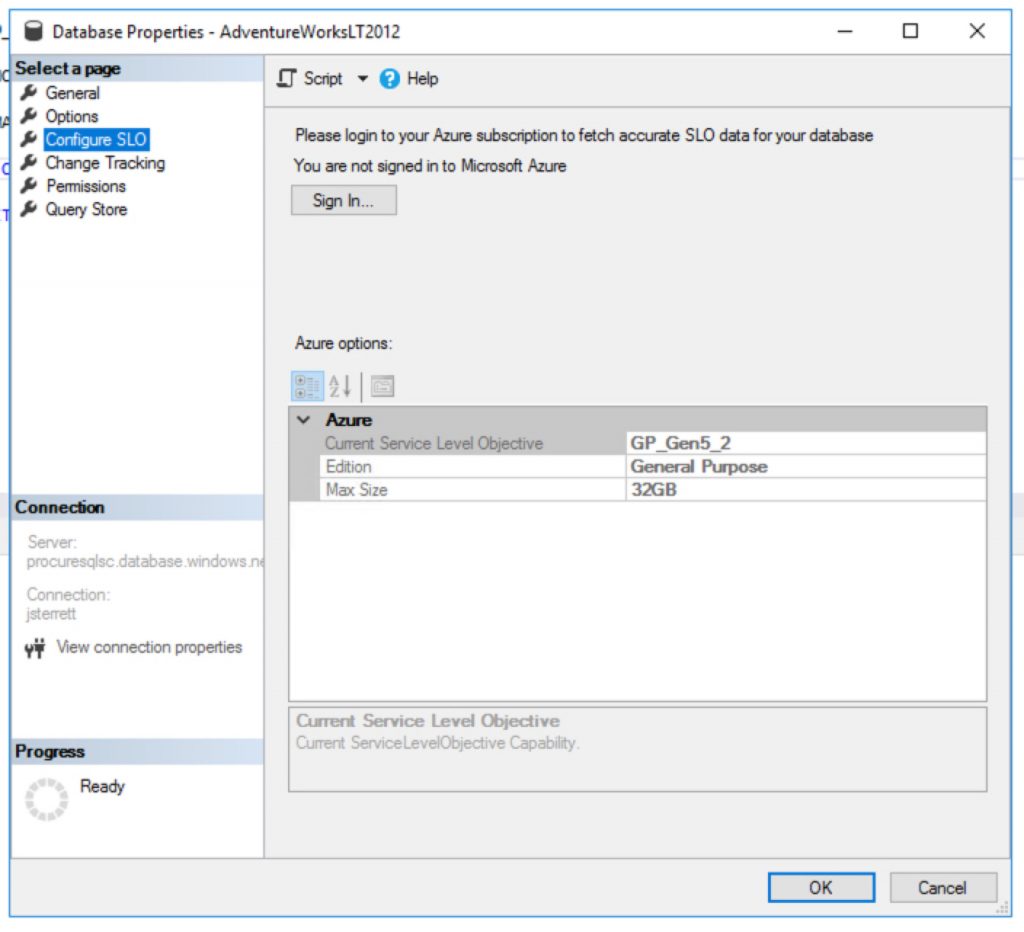
Great question, as of 3/3/2020 if the database in Azure SQL Database does not exist then it will be created. When its created the following database uses the default performance tier. This is General Purpose (Gen5) with 2 vCores.
How to create cheaper databases
Great question, you can import databases to Azure SQL Database cheaper using PowerShell. It is as simple as using the Azure PowerShell Module. The following example below I use my existing Azure SQL Database server and I end up creating a new database with the “S0” tier.
You got all the nuts and bolts to generate a script that can migrate all your databases on an instance. Then you can import databases to Azure SQL Database in one loop.
Today I wanted to cover how you can grant the least privilege required to stop, start or restart an Azure VM. This is also a fun great example of how you can create custom Azure Security Roles too. That’s right, we are killing two birds with one stone today.
Why Should you create a custom Role?
Where possible I like to grant security towards resource groups. Therefore, let’s assume we got multiple VM’s built for the developer group to do some testing. You want to grant people access to start, restart or stop any VM in that group. We can then grant access to the resource group to our custom role. As VMs come in and out of the resource group they would inherit our custom group.
Now, you might be wondering why don’t I just give them the “Contributor” role or the “Virtual Machine Contributor” role and be on our way? Well, if you were to do this on a resource group you just gave access to create VM’s and a whole lot more.
Least privileged roles are your best friend. Today, you will see they are also not that hard to create either.
How do we create custom roles?
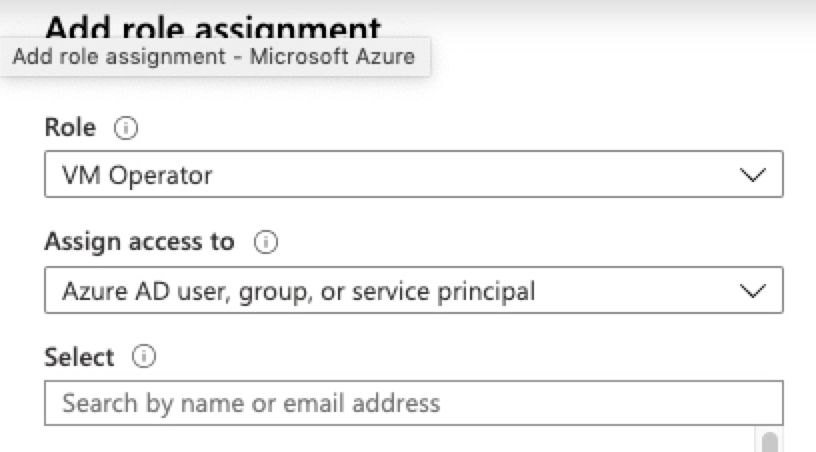
Great question, first you need to identify what tasks do we need the role to complete. In our case, you have to be able to see a VM in order to take any action against the VM. Then we want to start, stop (deallocate), and restart the VM. Digging through IAM. I found the following security options.
Now, we can create our custom JSON text file that we will then import using Azure CLI. Below you will find a sample JSON file to build our custom security role. You will need to add your subscription id(s). You can also change your name and description you would see in the Azure Portal.
Now that we are ready to go with our custom security role in a JSON file. We can then utilize Azure CLI to log in to the tenant and import our security role. First, we will log in to Azure with CLI as shown below.
az login --username <myEmailAddress> -t <customerTenantId-or-Domain>
Now we will load our saved JSON file. After a few minutes, we should then see our new security role in the Azure portal.
az role definition create --role-definition IAMRole-VMOperator.json
Now you can grant access to your custom role just like you would with any other role in Azure.
Hello everyone, this is John your Austin SQL Server Consultant here and today I am going to answer a question that comes up often so I wanted to blog about it for everyone. The question of the day is where can I download the previous SQL Server Updates?
The History towards Updates
Back in the day when we were young but not a kid anymore there were service packs and cumulative updates. We could download these separately and all of the updates were easy to find. Now today, if you click on a KB article to download an update you get pointed to the latest update as shown below.
How far is My SQL Server on Updates?
This is also another great question. My favorite place to find all the history of updates toward SQL Server is the SQL Server Build List Blog. You can cross-reference this towards your version by running the following query below.
I fully get exactly why Microsoft is trying to point everyone to the latest update. Normally, it makes perfect sense but let’s take a look at today Jan 9th, 2020. I am planning to update SQL Server 2017 to CU17. Its been out for two months. Today CU18 is released and if I wasn’t careful I would have downloaded a different update than expected.
Getting a previous SQL Server Update
So, on to the solution. It’s actually an easy one but also one that is easy to overlook as well. Let’s go back to the new standard update page for SQL Server updates.
That is right, the Microsoft Update Catalog is your best friend to find all your updates for Microsoft products including SQL Server. You can search for the product you want. For example, in this case, I am looking for SQL Server 2017 and can see all the previous updates for SQL Server.
If you enjoyed this tip and found it helped make sure to join our newsletter so you can enjoy more free tips, tricks, and video demos.
Hello everyone! This is your SQL Server Consultant in Austin, TX and due to some posts on twitter about SQL PASS recordings costing $999 I wanted to share some of my favorite places to find free SQL Server training videos. I hope this helps make your data fast, secure and highly available in 2020 and beyond!
Where Is the Good Stuff Give Me Some More
Those who know me know I love music. I especially love the underground non-mainstream content. Therefore, my first recommendation is UserGroup.TV. As of December 27th, there are 127 videos tagged as SQL Saturday alone. Shawn goes around to almost every Tech conference he can find and brings his rig and records sessions for the community.
Are you in love with the new pop singles? Wish you could hear them before they hit the radio? If you like your tech like your music than Microsoft Ignite is for you. Every year Microsoft puts on a conference called, Ignite. This conference is usually where Microsoft will break its cutting edge tech. My favorite thing about the conference is that the content is available online for free. Midway through the page, you can search through the massive collection of free recorded sessions.
Next up, is the consistent greatest hits. Almost every session is a banger! This reminds me of my favorite Microsoft Data Platform conference. This is SQLBits and yes, their video content is also available for FREE.
/wp-content/uploads/2024/05/Data-Architecture-as-a-Service-with-ProcureSQL.png00JohnSterrett/wp-content/uploads/2024/05/Data-Architecture-as-a-Service-with-ProcureSQL.pngJohnSterrett2019-12-27 15:59:022019-12-27 15:59:02Free SQL Server Training Videos